Google made Core Web Vitals a ranking signal back in 2021. Since then, the technical standards haven't changed dramatically - but the mistakes sites keep making have stayed remarkably consistent. Teams check desktop scores and miss why mobile traffic underperforms. They fix what Lighthouse flags and wonder why Search Console still shows red. They deploy a fix, look at field data the next day, and assume nothing worked.
This guide is built to close those gaps. We'll cover what each metric actually measures, why most sites fail them, how to fix the root causes rather than the surface symptoms, and how to verify that your changes actually register in Google's data - not just in a lab score.
What Core Web Vitals Actually Measure
Before you can audit anything, you need to understand what these three metrics are tracking - and why each one matters to a real visitor, not just to a ranking algorithm.
LCP - Largest Contentful Paint
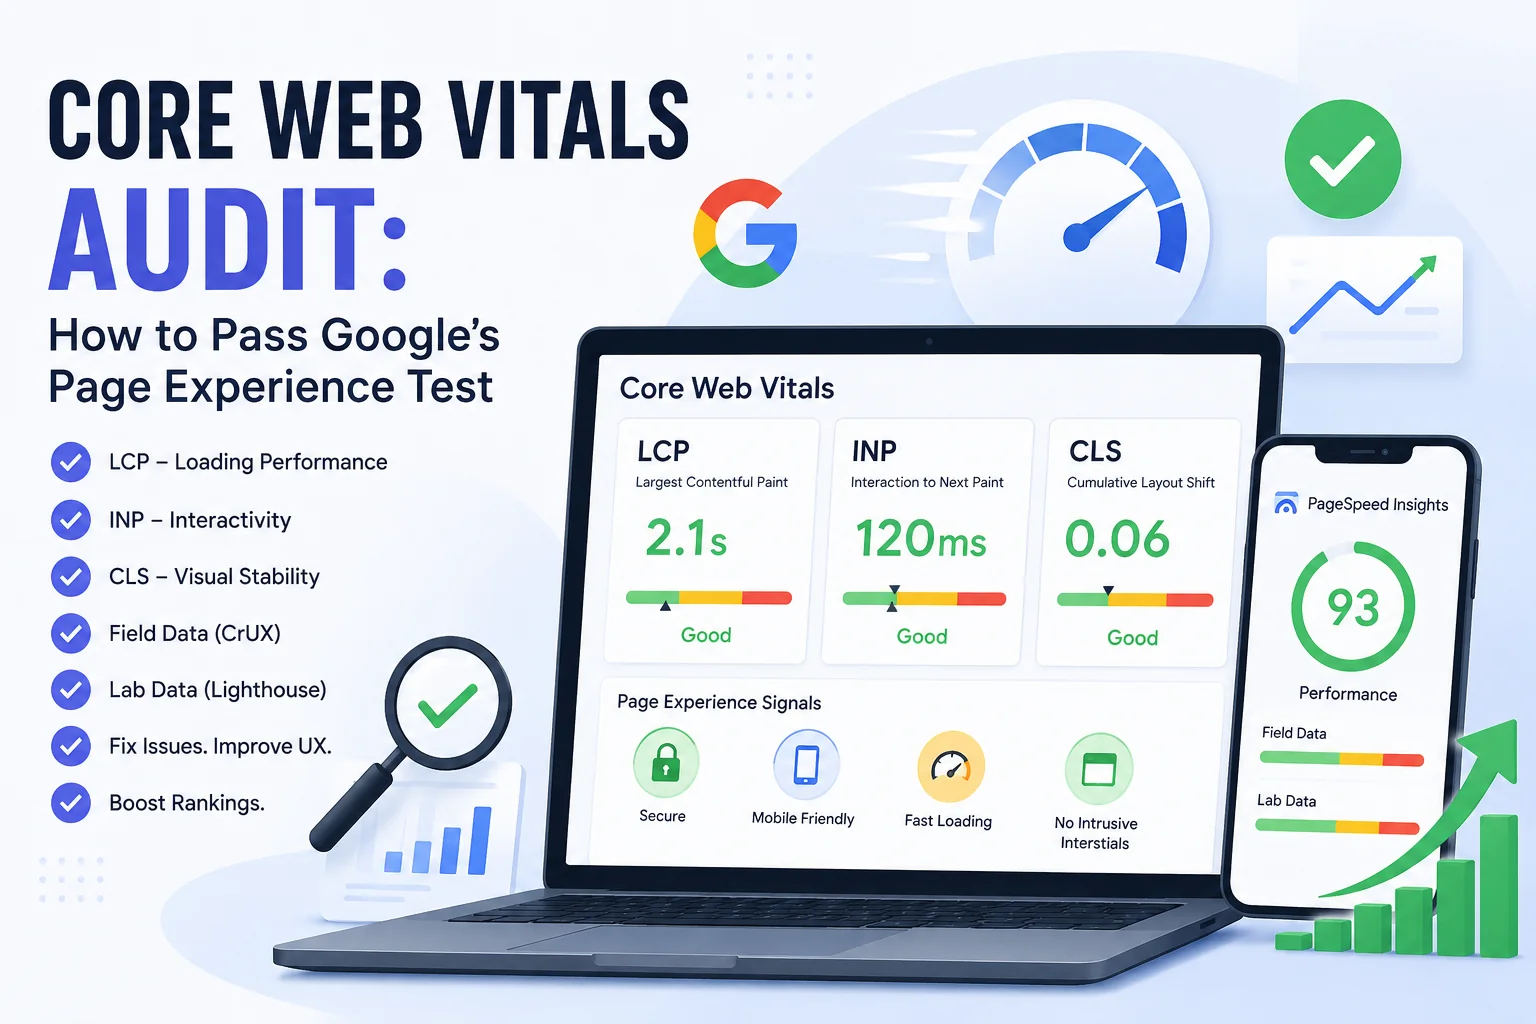
LCP measures loading performance: specifically, how long it takes for the largest visible element on screen to finish rendering. That's usually a hero image, a large heading, or a video thumbnail. Google's threshold is 2.5 seconds or under for a "Good" score. Above 4.0 seconds is classified as Poor.
What makes LCP tricky is that it's not just about image file size. Server response time, render-blocking resources, and how the browser discovers the image all feed into the final number. A 200KB WebP image that the browser finds late still produces a slow LCP.
INP - Interaction to Next Paint
INP replaced First Input Delay (FID) as an official Core Web Vital in March 2024. It measures responsiveness - specifically, the delay between a user interaction (a click, a tap, a keypress) and the next visual update on screen.
The threshold is 200ms or under for Good. Above 500ms is poor. Unlike FID, which only measures the first interaction, INP captures the worst interaction across an entire session. That makes it a much more honest measure of how a page actually behaves.
CLS - Cumulative Layout Shift
CLS measures visual stability - how much the page layout moves unexpectedly after it first renders. Images that pop in and push text down, ads that load above the fold, fonts that swap and reflow the paragraph you were reading. These aren't just annoying; they're measurable.
A CLS of 0.1 or under is Good. Above 0.25 is Poor.
The Supporting Cast
You'll also see FCP (First Contentful Paint), TBT (Total Blocking Time), and TTI (Time to Interactive) in audit reports. These are diagnostic metrics - important for understanding why LCP or INP is failing, but not direct ranking signals. Use them to dig into causes, not to benchmark your overall score.
The Field Data vs. Lab Data Problem
This is the part that causes the most confusion - and the most wasted effort.
Field data comes from real Chrome users visiting your actual pages. Google collects this through the Chrome User Experience Report (CrUX), which aggregates performance measurements from genuine browsing sessions. This is the data Google uses for ranking.
Lab data is simulated. Lighthouse, the PageSpeed Insights lab section, and Chrome DevTools run your page in a controlled environment and produce a score based on a single synthetic session. Lab data is invaluable for diagnosing specific issues - but it is not what Google ranks you on.
The practical consequence is significant: a page can score 94 in Lighthouse and still fail Google's field thresholds. If your real users are on mid-range Android devices with variable LTE connections, their experience is what the algorithm sees. Your MacBook Pro on a fiber connection is not a representative sample.
One important caveat: if your site doesn't receive enough traffic, Google may not have sufficient CrUX data to generate URL-level field data. In that case, Google falls back to domain-level data - or the page simply won't have a Core Web Vitals status in Search Console at all.
The rule of thumb: always check both. But treat field data as the target and lab data as the diagnostic tool.
How to Run a Core Web Vitals Audit: The Right Tools for Each Job
No single tool gives you the complete picture. Here's what each option is genuinely useful for.
Google PageSpeed Insights
pagespeed.web.dev shows both field data (when available) and lab scores for any public URL. It's free, fast, and the most direct way to check a single page. The limitation is scale: it's manual, one URL at a time, with no historical tracking or bulk export.
Google Search Console - Core Web Vitals Report
This is where you monitor your site's actual status over time. The report groups pages by status (Good, Needs Improvement, Poor) using CrUX field data, shows 28-day rolling trends, and identifies which URL groups have problems. You need verified property ownership to access it. For ongoing monitoring, this is the authoritative source.
Chrome DevTools and Lighthouse
These run lab-only analysis. Most useful during development, when you want to measure the impact of a specific change before it hits production. The Performance panel in DevTools is particularly powerful for diagnosing INP issues and identifying long tasks.
SEOAudit Tool - For Multi-Page and Multi-Site Audits
Running PageSpeed Insights manually across dozens of pages, then cross-referencing results with a separate crawl tool, then pulling GBP data from somewhere else - that's three workflows for what should be one job. SEOAudit Tool consolidates all of it into a single automated report delivered in about three minutes.
Here's what's actually inside: 6 report sections covering everything from Core Web Vitals to Google Business Profile.
Technical SEO: PageSpeed scores (desktop and mobile), Core Web Vitals breakdown - LCP, FCP, CLS, TBT - plus HTTPS status, mobile usability, crawlability, and structured data validation.
On-Page Analysis: Title tags, meta descriptions, heading structure, canonical tags, and internal linking. The elements that still matter enormously and that most performance-focused audits quietly skip.
Google Business Profile Audit: Profile completeness check, review sentiment analysis, competitor comparison, and identification of missing or incomplete fields. If you're working with local businesses, this alone changes the scope of what an "SEO audit" means.
Organic Visibility: Keyword rankings, estimated traffic, and position distribution pulled via DataForSEO. You get actual ranking context alongside the technical data, not just scores in a vacuum.
Ad Forecast & Budget Planner: Google Ads budget recommendations with CPC analysis and conversion estimates. Useful for clients who are weighing paid versus organic investment, or for agencies that handle both.
AI-Powered Recommendations: Not a generic checklist. The AI analyzes the specific data from your site and generates prioritized fixes ranked by expected ranking impact. The difference between "your images aren't optimized" and "your LCP hero image on mobile is 9.9s - here's why and what to fix first" is the difference between this and most other audit tools.
The report is delivered as a DOCX file to your email - no dashboard to log into, no subscription to maintain. It costs $1.61 per single audit with no registration required. If you're running audits regularly, a pack of 25 brings the cost down to $1.29 each, with dashboard access and credits that never expire.
For freelancers and small agencies, this is a practical alternative to an enterprise platform that requires a monthly commitment regardless of how many audits you actually run in a given month. The report is available in 6 languages: English, German, Polish, Czech, Slovak, and Russian.
Reading the Numbers: What the Thresholds Actually Mean
Metric | Good | Needs Improvement | Poor |
LCP | ≤ 2.5s | 2.5s - 4.0s | > 4.0s |
INP | ≤ 200ms | 200ms - 500ms | > 500ms |
CLS | ≤ 0.10 | 0.10 - 0.25 | > 0.25 |
Two details here that are easy to miss.
Google uses the 75th percentile. A page passes a metric only if at least 75% of real sessions hit the "Good" threshold. If your LCP is 2.1 seconds for 80% of visitors but 6.0 seconds for the remaining 20%, you fail LCP. This means optimizing for average or median performance isn't enough - you need to fix the slow tail of your user distribution.
Desktop and mobile are evaluated independently. A perfect desktop score does not carry over to mobile. In practice, mobile LCP is almost always significantly worse - slower CPUs, variable network conditions, and images that weren't scaled for small screens all compound. Audit both. Treat mobile as the harder and more important problem.
The Most Common Failures - And How to Fix the Root Cause
Slow LCP: It's Usually the Hero Image (But Not Always Just the Image)
The most frequent cause of a poor LCP is an unoptimized hero image that the browser discovers late and fetches at normal queue priority. But slow server response time (TTFB above 600ms) can make even a perfectly optimized image load slowly, because the browser is waiting for the initial HTML before it can find the image at all.
Fix the image:
Convert to WebP or AVIF. These formats deliver equivalent visual quality at 25–50% smaller file sizes than JPEG or PNG.
Add <link rel="preload" as="image"> in the <head> for your LCP element. This tells the browser to fetch it early, before it finishes parsing the full HTML.
Set fetchpriority="high" on the <img> tag of your LCP element. Without this, even preloaded images may be deprioritized.
Fix the server:
If TTFB is consistently above 600ms, implement a CDN, enable server-side caching, or move to faster hosting. No image optimization compensates for a slow server.
Fix render-blocking resources:
Audit CSS and JavaScript loaded before the LCP element. Anything that blocks rendering delays when the browser can first paint the page. Defer non-critical scripts and inline only the CSS needed for above-the-fold content.
Poor INP: JavaScript Is Blocking the Main Thread
INP failures trace back to JavaScript almost every time. When a user clicks something and the browser is busy executing a long task, it can't process the interaction until that task finishes. The result is the gap between the click and anything visibly happening - and users notice it at 200ms.
Find and break up long tasks:
Open Chrome DevTools' Performance panel, record a typical interaction, and look for tasks over 50ms (highlighted in red). These are your targets.
Break long tasks using scheduler.yield() to give the browser windows to handle user input between chunks of work.
Audit your third-party scripts:
Chat widgets, analytics tags, A/B testing tools, ad scripts. These are one of the most common sources of main-thread congestion, and they're often loaded synchronously. Lazy-load them after the page becomes interactive, or audit whether all of them are actually necessary.
Reduce DOM size:
Pages with thousands of nodes are slower to update after any interaction. If your DOM is unusually large, look at how content is structured and whether elements are being kept in the DOM when they could be removed.
CLS Problems: Three Sources, Three Fixes
Layout shifts almost always come from one of three places.
Images and embeds without explicit dimensions: Always set width and height attributes on <img> and <video> elements. This lets the browser reserve the correct space before the resource loads, so the layout doesn't shift when the image arrives. This single fix resolves the majority of CLS issues on image-heavy pages.
Web fonts swapping at render time: Use font-display: swap combined with size-adjust to minimize the visual difference between the fallback font and the web font. Without size-adjust, even a brief swap can reflow several paragraphs of text. Consider using the <link rel="preload"> tag for critical fonts.
Dynamically injected content: Cookie consent banners, promotional bars, sticky headers, chat bubbles - if anything is being inserted above existing content after the page loads, it will cause a layout shift. Reserve the space in the layout before the content appears. Never insert content above the fold without a pre-allocated container.
Core Web Vitals Don't Exist in Isolation
A page with an LCP of 1.8 seconds and a CLS of 0.02 can still rank poorly. Performance metrics are one layer in Google's evaluation of page quality - not the whole picture.
A complete technical SEO analysis needs to cover both sides: performance signals and structural SEO signals. That means checking HTTPS status, mobile usability, structured data implementation, crawlability, title tags, meta descriptions, heading hierarchy, canonical tags, and internal linking - at the same time as Core Web Vitals.
This is where a combined audit tool earns its place. When you can see that a page has an LCP of 4.3 seconds and a missing canonical and mobile usability errors in the same report, you can prioritize fixes by actual ranking impact instead of working down a list in arbitrary order.
SEOAudit Tool produces exactly this kind of report in one pass: PageSpeed scores, Core Web Vitals breakdown, on-page analysis, structured data check, and AI-generated recommendations ranked by impact. It's designed for people who need a complete picture quickly - not a platform that requires an hour of setup before you can read the output.
How to Monitor After You Fix Something
Here's the frustration most teams run into: they deploy a fix, check PageSpeed Insights the next day, and the field data looks unchanged. They assume the fix didn't work.
It worked. The data just hasn't caught up yet.
Google's field data is based on a rolling 28-day window from CrUX. A change deployed today only fully reflects in Search Console after roughly 28-35 days of real user sessions under the improved experience. Lab scores (Lighthouse) update immediately - but again, those aren't what affect ranking.
What to do in the meantime:
Re-run lab tests immediately after deployment to confirm the fix is working before the wait begins.
Use Google Search Console's Core Web Vitals report to watch for status changes in URL groups over the following weeks.
Set a calendar reminder to check field data 30-35 days post-deployment.
Monitor for regressions after CMS updates, plugin installations, or new third-party script additions. A single new analytics tag or chat widget can push INP into the Poor range overnight - and it won't show up in field data for a month.
Core Web Vitals Audit Checklist
Use this as your starting point for any audit, whether you're running it manually or using a tool.
Run PageSpeed Insights on your homepage and top 5-10 landing pages by organic traffic
Open Google Search Console → Core Web Vitals report; check site-wide status and trends
Review desktop and mobile results separately - treat them as independent problems
Identify which metric is failing: LCP, INP, CLS, or some combination
Start with field data to understand the real user experience; use lab data to diagnose the cause
For LCP: check image format and file size, preload status, TTFB, and render-blocking resources
For INP: profile JavaScript in Chrome DevTools; identify and break up long tasks; audit third-party scripts
For CLS: verify all images and embeds have explicit width and height; check font loading; audit dynamically injected content
Run a full technical SEO analysis to surface co-occurring crawl and on-page issues
Re-audit in 28-35 days to confirm improvement in field data - not just lab scores
Core Web Vitals are not mysterious. Every metric has a defined threshold, a documented measurement method, and a finite set of fixable causes. The audit process is repeatable once you know what data to look at and in what sequence.
The sites that consistently pass LCP, INP, and CLS thresholds aren't doing anything exotic. They run audits regularly, they treat performance as part of ongoing SEO maintenance rather than a launch checklist item, and they check field data - not just Lighthouse - to confirm that improvements are actually showing up where Google can see them.
If you want a complete picture in one report - Core Web Vitals data, PageSpeed scores, on-page signals, and recommendations ranked by likely ranking impact - run an audit on SEOAudit Tool for $1.61. No registration required, results delivered in about three minutes.
FAQ
Does fixing Core Web Vitals improve Google rankings?
Yes. Core Web Vitals are a confirmed Google ranking signal. Fixing them removes a performance penalty - but they work alongside content quality and backlinks, not instead of them.
How long before improvements show up in Search Console?
Around 28-35 days. Google's field data uses a rolling 28-day CrUX window. Lab scores (Lighthouse) update immediately but don't affect ranking.
Why does my Lighthouse score look good but Search Console shows "Poor"?
They measure different things. Lighthouse simulates a single lab session; Search Console shows real Chrome user data. Your actual visitors - often on slower mobile devices - can have a much worse experience than your lab score suggests.
Which Core Web Vital is hardest to fix?
INP. It requires profiling JavaScript execution and often tracing third-party scripts or framework rendering behavior. LCP and CLS have more direct, targeted fixes.
Are mobile and desktop Core Web Vitals evaluated separately?
Yes. Google scores them independently. Mobile is almost always worse and typically has the bigger impact on overall rankings.
What's the difference between LCP and FCP?
FCP marks when the browser first renders any content. LCP marks when the largest visible element finishes loading - which is what Google actually cares about as a measure of perceived load speed.
Can a slow server cause CWV failures even with optimized images?
Yes. If TTFB exceeds 600ms, image optimization won't save your LCP - the browser can't fetch anything until the server responds. Fix TTFB first with a CDN or server-side caching.
Is there a tool that covers Core Web Vitals and full SEO in one report?
Yes - SEOAudit Tool delivers PageSpeed scores, Core Web Vitals, on-page SEO, structured data, GBP audit, organic visibility, and AI-prioritized recommendations in one DOCX report. $1.61 per audit, ~3 minutes, no registration.